Table of Contents
Overview
This resource is an experiential demonstration of the force of gravity. The force of gravity is what keeps our feet on the ground. We are all accelerating at around 9.8 metres per second per second towards the center of the earth.
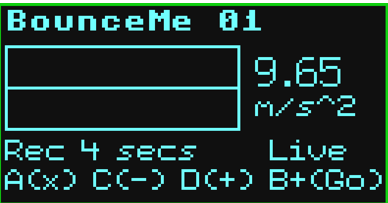
We can see this acceleration on the Kookaberry’s screen when resting vertically on a horizontal surface and running the BounceMe app.
In this demonstration we will suspend a Kookaberry running BounceMe on an elastic cord; drop it, and observe the steadily decaying amplitude of its acceleration over time until it comes to rest.
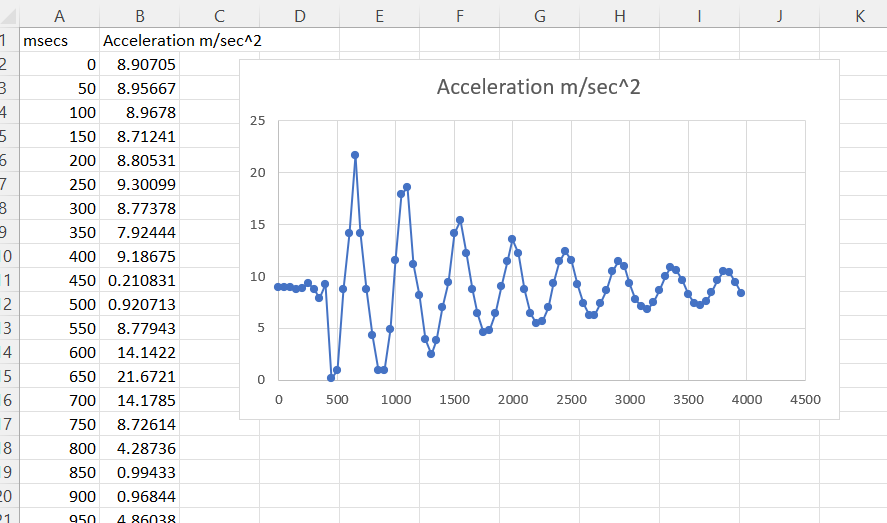
This data used to create this graph was logged by the Kookaberry and stored in its onboard USB memory for display and analysis on a computer.
Question: What actually is Weightlessness?
Answer: When the force of gravity acting on a body no longer exists – it is zero.
[Follow-up Question: If a body has no weight, does it still have mass?]
Analysis of the Graph
- The graph shows the value of the gravitational force measured at 50 millisecond intervals as the Kookaberry falls freely and then bounces up and down until it finally comes to rest.
- The accelerometer embedded on the Kookaberry is actually measuring acceleration along three axes. The value shown on the screen is the composite (root mean square) value of these three acceleration vectors.
- The zero acceleration value is NOT the point where the Kookaberry first comes to rest – that would actually be 9.8 meters per second squared. The zero value is actually the point where the Kookaberry’s acceleration UPWARDS exactly balances the force of gravity pulling it DOWNWARDS.
Further Enquiry
- Why do you think the acceleration cycle gets smaller over time? (Hint: elastic is not perfectly elastic)
- Use calculus to determine the velocity and speed of the Kookaberry when the acceleration is zero. (Hint: First create a second column of acceleration values by subtracting the starting acceleration from the measured value at each point in time)
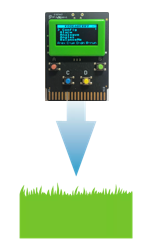
Demonstration setup
- Suspend the Kookaberry, together with its handle and battery from a hook using about 20cm of hat elastic.
- Run the BounceMe app
- Observe that the gravitational force is around 9.8 meters per second squared at rest.
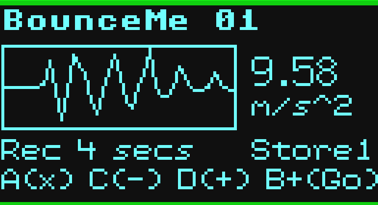
- Press Button B for more than 1 second and release the Kookaberry so that it bounces until it comes to rest again. Observe the acceleration graph on the Kookaberry’s screen.
- Remove the Kookaberry from its hook; exit the app (press Button A); then
- Find and run GraphCSV;
- Select the BounceMe001.csv file in the app and press Button B to create a HTML file in the Kookaberry’s memory.
- Connect the Kookaberry to a computer and either
- display the graph directly on a web browser by double-clicking the BounceMe001.htm file, or
- import the BounceMe001.csv file to Excel and create a graph