Data logging and on-board storage of the data being measured is a unique feature of the Kookaberry.
In this tutorial the LightMe app will be used to measure the level of ambient light over time. The measured values will then be uploaded to a computer and displayed as a graph in an Excel spreadsheet.
Changing the data logging frequency
First we must check that the data logging frequency is appropriate for the measurements being made.
The default interval between the writing (logging) of each data measurement into the USB memory is 10 seconds. This means that every 10 seconds the measured value is recorded and stored.
This logging rate can be adjusted in the _config app at the head of the Menu. For instance, if we were to measure the temperature variation on a back patio, we might choose to sample every 30 minutes.
In this demonstration we will change the logging rate to every 2 seconds.
NOTE: the data logging rate is not the same parameter as the sampling rate applied to the incoming analogue signal – which is very much faster.
Step 1: Navigation
Go to the _config app at head of Menu and press Button B to run. An information screen then appears containing firmware version details. Press Button A and then Button B to go to the screen where the data logging interval can be changed.


Step 2: Changing the interval
 Decrease the interval from the default value of 10 seconds to 2 seconds using Button D. Press Button A to Exit, return to Menu, and save the changed parameters.
Reading the ambient light level
Step 1: Setup
Connect a Kookaberry to a charged battery and turn it on as described in the Tutorial: Getting Started
Connect an Ambient Light Sensor to one end of a 3-wire jst connecting lead and plug the other end into the P4 connector on the back of the Kookaberry. Do the same for an LED, and plug into connector P2.


Scroll down the menu to the LightMe app and press the green button B to run.
Step 2 Running the app
 The analogue signal from the ambient light sensor is displayed as a “tank” icon whose level varies according to the level of the light being detected.
The two lines on the tank are the threshold levels which trigger LED operation. The top one switches the LED ON as the light level diminishes, and the bottom one switches it OFF as it increases again.
Adjust the threshold levels to turn the light off in the current lighting conditions by pressing the C and D buttons. If the light is too bright for threshold adjustment, place a piece of paper or cloth over the sensor.
Switch the LED ON and OFF by placing your hand over the sensor for 10-20 secs. The measured value will be logged and stored in the USB memory as a file called LightMe.csv.
Exit the app and return to the Menu by pressing Button A. This will stop the data logging operation.
Displaying the logged data in a browser
 The data can be displayed directly in the browser of a connected computer by running the csv data through the GraphCSV app and choosing what sort of graph is required (default is a line graph).
After exiting the LightMe app, but before connecting the Kookaberry to a computer, navigate to the GraphCSV app and press Button B to run.
 All the csv files that are stored in the USB memory are displayed. Navigate to the LightMe.csv file using Button C and Press Button B to start the conversion of the data into html for display on a browser.
The blue LED on the back of the Kookaberry will flash during conversion. After it stops flashing, Press Button A to Exit and then remove the power from the Kookaberry and then restore it again. This transfers the html data into the USB memory.
 Now connect the Kookaberry to a computer and you will see the following files and folders in the USB memory.
Double click on the LightMe.htm file and you will see the graph of the changes in ambient light level displayed in your browser.
It also includes the threshold values and switch events.
This graph cannot be altered or analysed further once changed into html format.

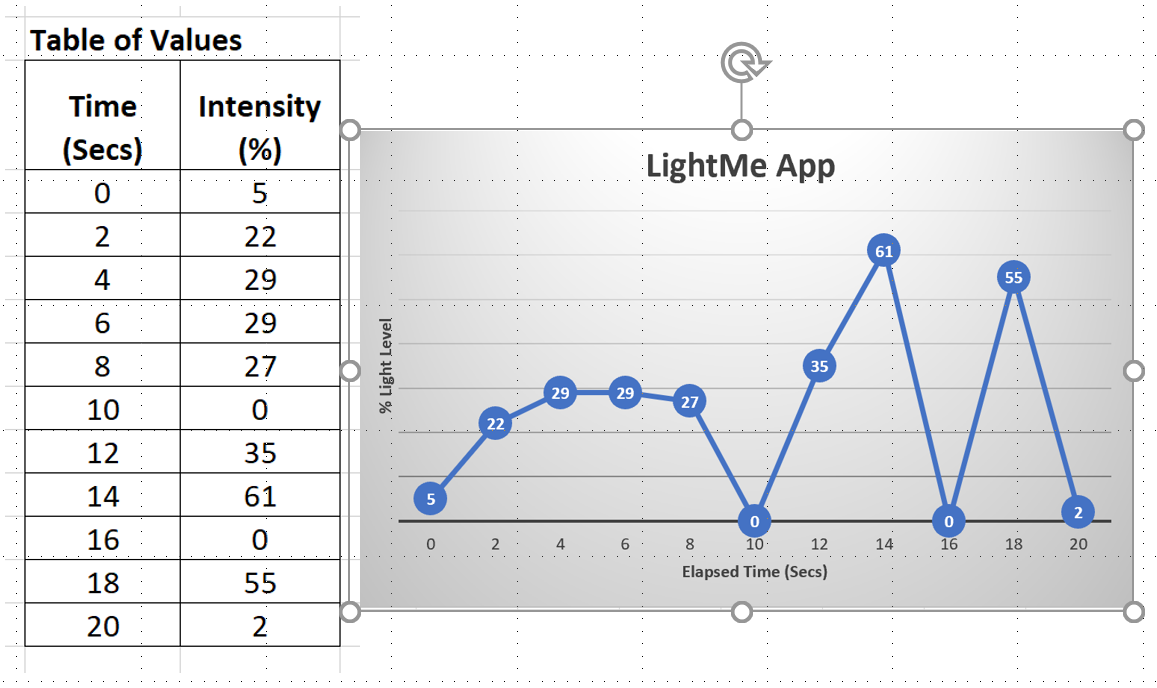
Displaying and analysing the logged data in Excel
Connect the Kookaberry to a computer and open the LightMe.csv file in Excel. Highlight just the Timer and Light% columns; select “Insert” from top menu bar and click on “Recommended carts”.
This will display a graph like the one shown below which can then be displayed on a Smartboard and analysed further.

Save or close the Excel csv file before disconnecting the Kookaberry from the computer.