Table of Contents
This SenseSDS app measures the amount of small polluting particles in the air using a peripheral called an SDS011. The SDS011 uses a tiny laser to measure the total mass in micrograms per cubic metre of air of two sizes of particles.
A pdf of this App description can be downloaded from the side bar to the right.
Particulate Matter
Called Particulate Matter (PM), one size (PM2.5) has a diameter of 2.5micrometres or less; and the other (PM10) has a diameter of 10 micrometres or less. These diameters are very very small as shown in the pictogram below.
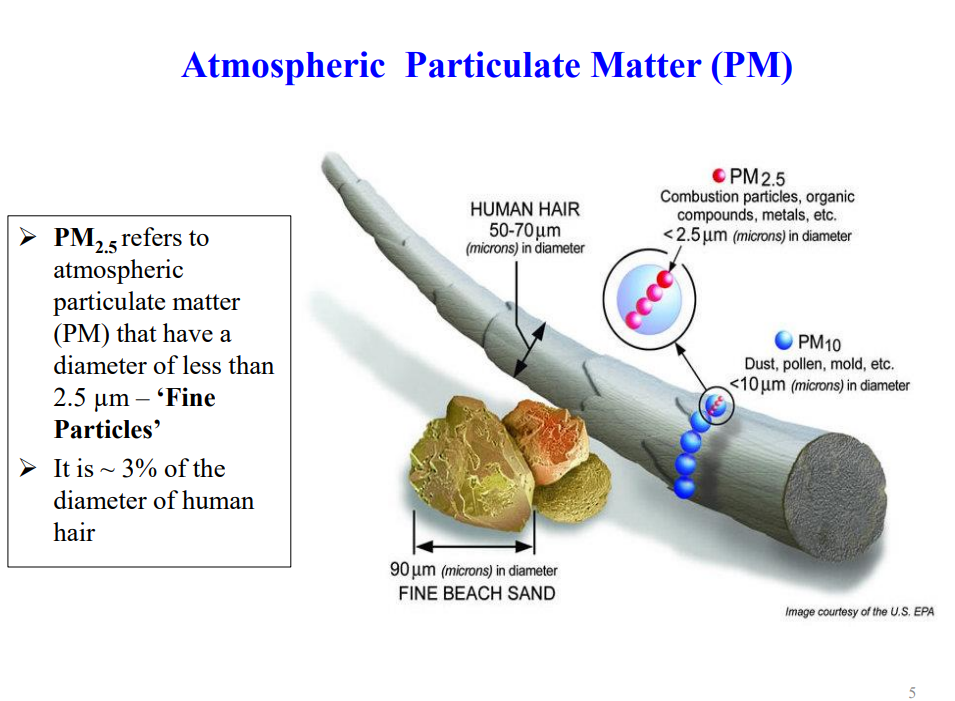
PM2.5 particles are so small they can get deep into the lungs and into the bloodstream. There is sufficient evidence that exposure to PM2.5 over long periods (years) can cause adverse health effects. Note that PM10 includes PM2.5.
Air Quality Measurement
The Australian Government sets nationally consistent maximum levels of each pollutant against which state and territory governments are required to monitor air quality. However, there is variation in the way that States present their results and also in the way that indicate the health outcomes of various ranges of pollutant measurement. These variations were highlighted as in need of review in the Report of the Royal Commission into National Natural Disaster Arrangements, October 2020 (Chapter 14).
An Air Quality Index (AQI) has traditionally been the measure of a pollutant’s deviation from the national standard [An AQI of 100 means that the measurement is the same as the maximum level specified in the national standard].
However, some States (including NSW and Victoria) have changed to presenting their measurements within Air Quality Categories (AQC).
Air Quality Categories (AQC)
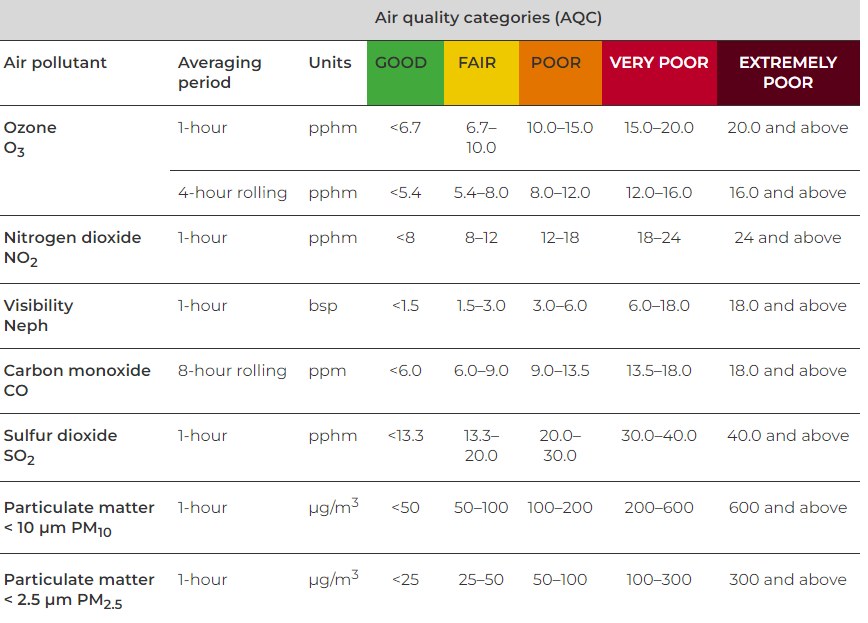
The measured levels of each pollutant are sorted into ranges from “Extremely Poor” to “Good”, and each range is colour coded. The categories are shown in the Table below. For example, a PM2.5 measurement of 150 micrograms per cubic meter of air would be categorised as “Poor”.
The NSW Department of Planning and Environment publish a Health Activity Guide based upon AQC. This offers general health advice against each AQC.
NSW Air Quality Data
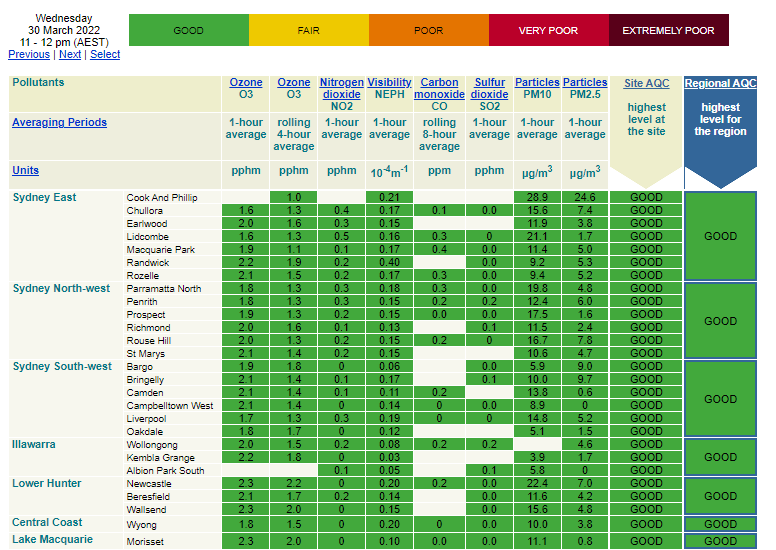
NSW posts air quality results at hourly intervals from different sites throughout the State on its Planning and Environment website. They are displayed as shown in the following Table
App Directions
Setup
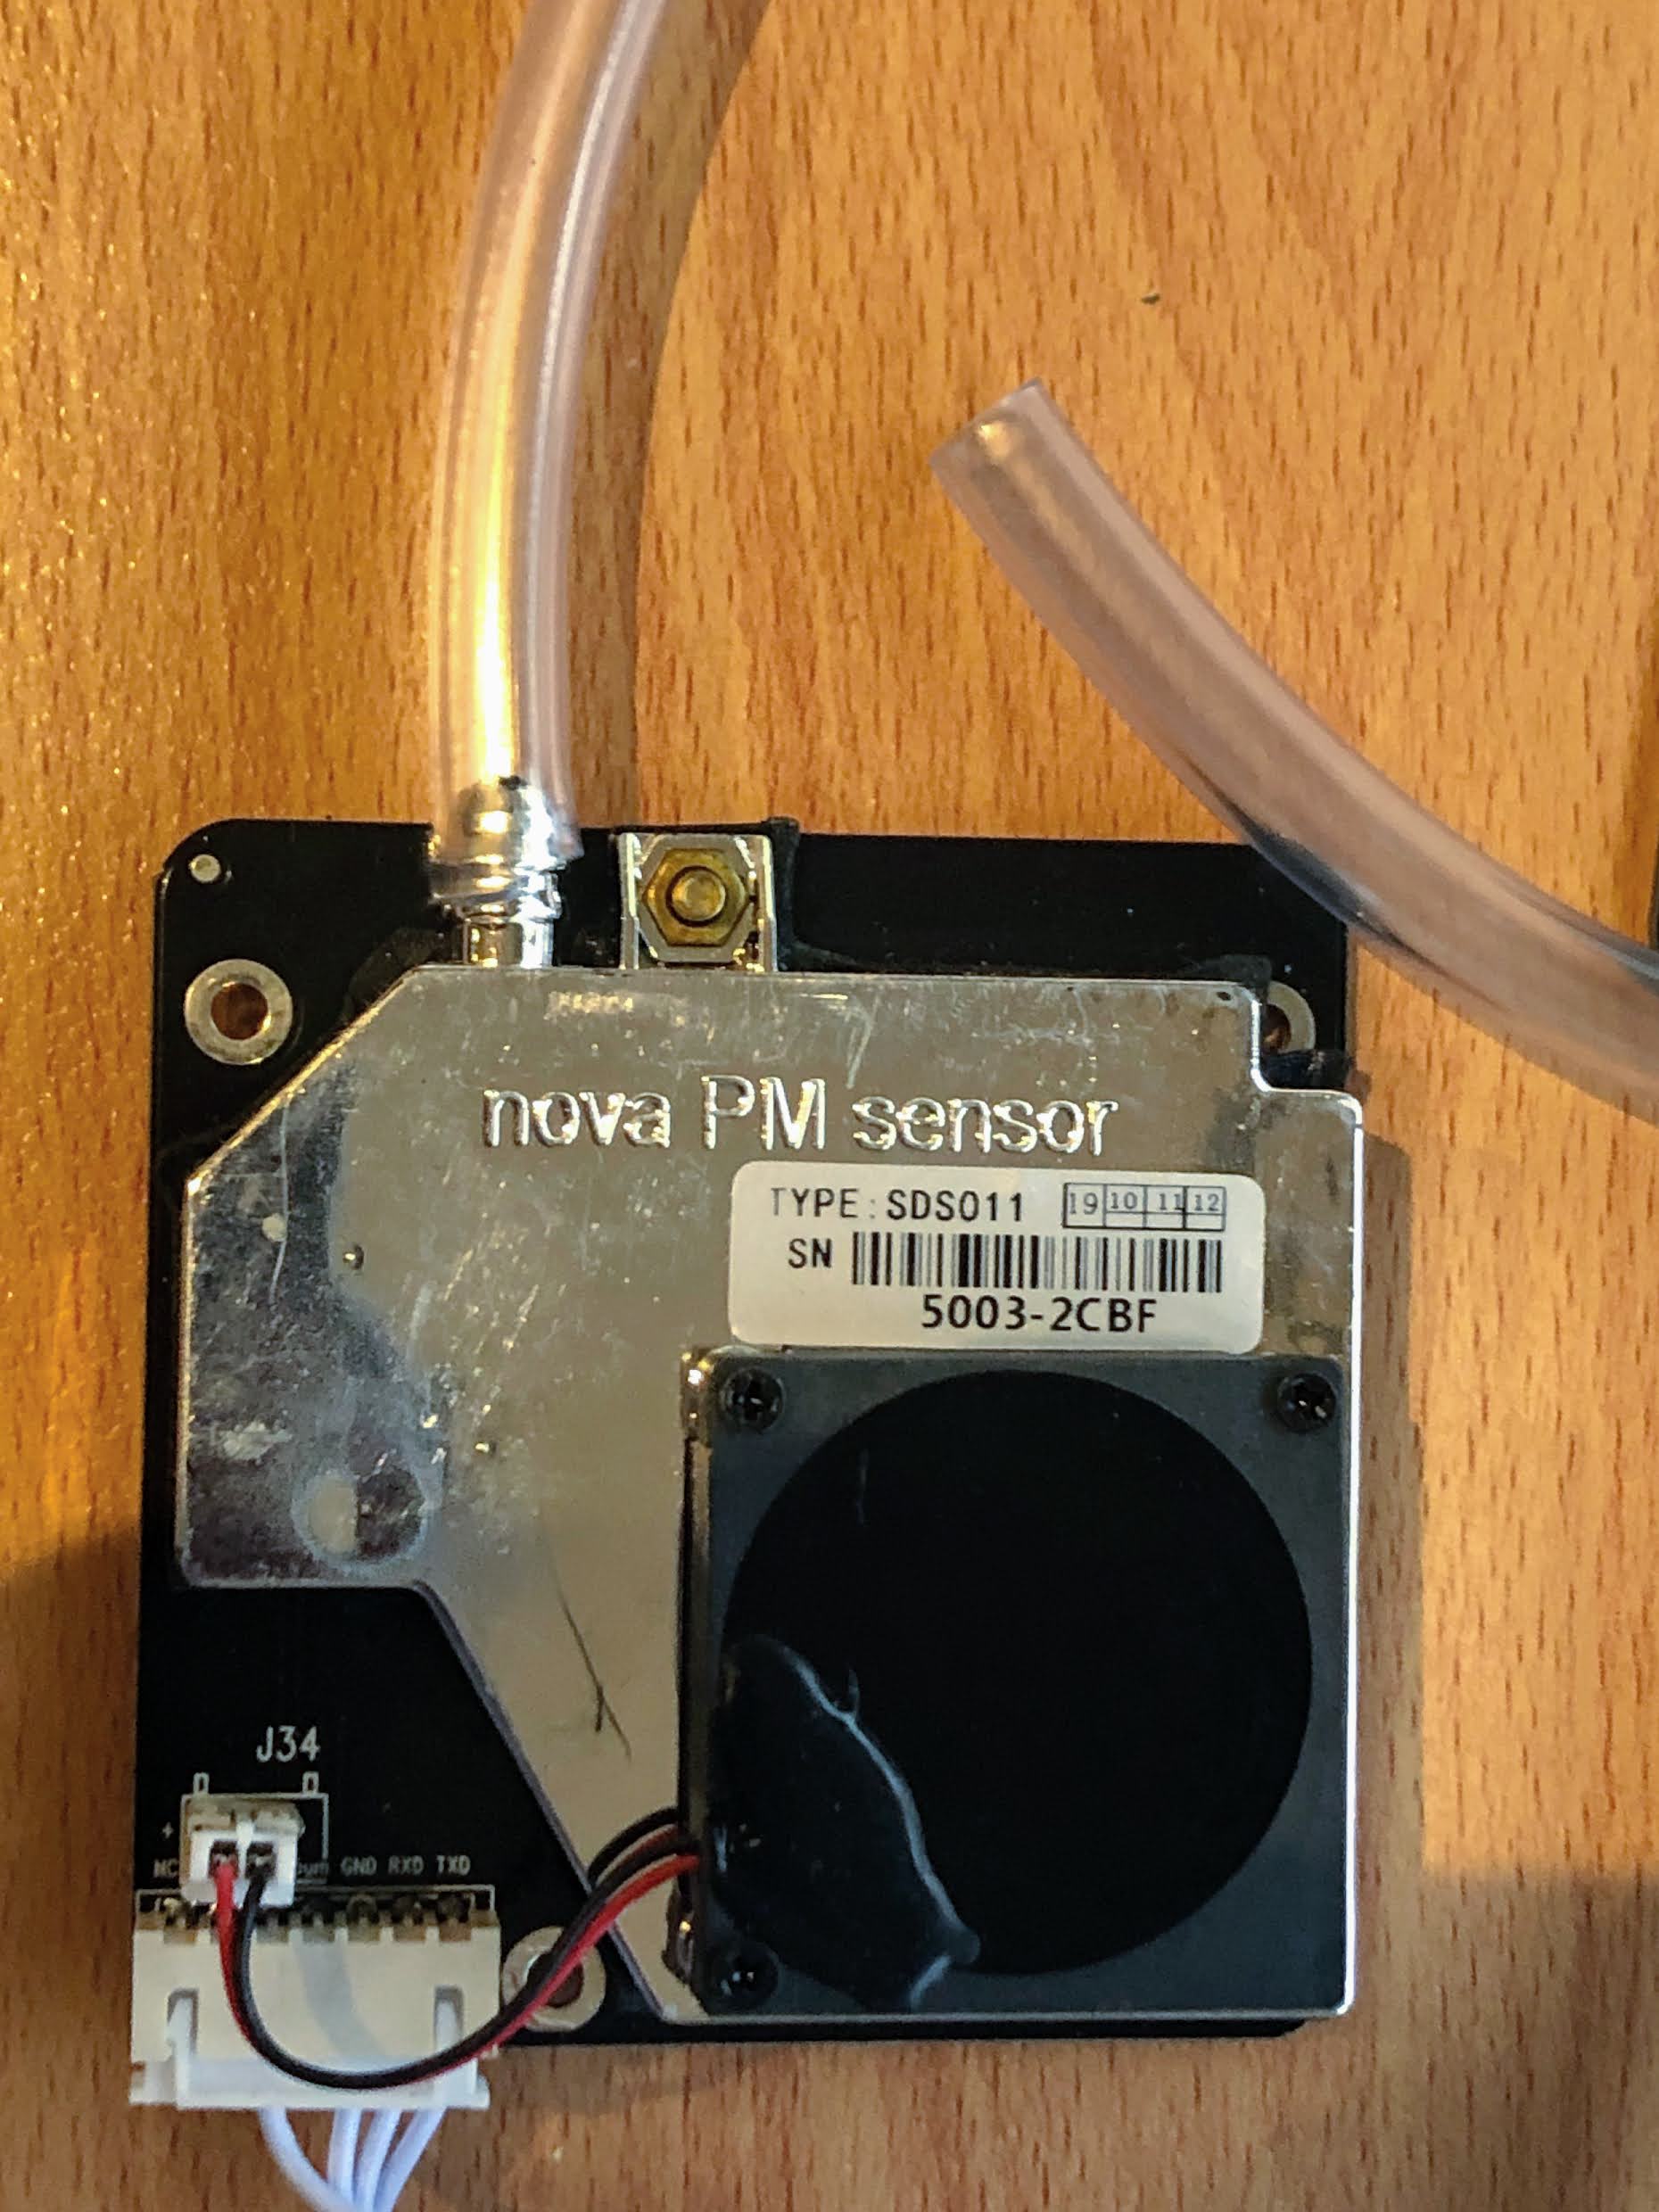
This App uses two peripherals – or rather one peripheral and an accessory. The accessory is a Particle Sensor Interface Module which, as its name suggests is the interface between the Kookaberry and the SDS011.
Power up and turn on your Kookaberry. If you havent done this before go the tutorial Getting started with your Kookaberry
Connect a 4pin JST to 4pin JST cable between P3 on the Kookaberry and the 4pin JST socket on the interface module. Provide power to the interface module (which sends it to SDS011) using either the 2pin JST socket or the 5v barrel socket. One configuration using Class Kit components is shown below.
[Tip: make sure the 4pin cable plugs are pushed right into the sockets otherwise it may not show a reading].

Running the App
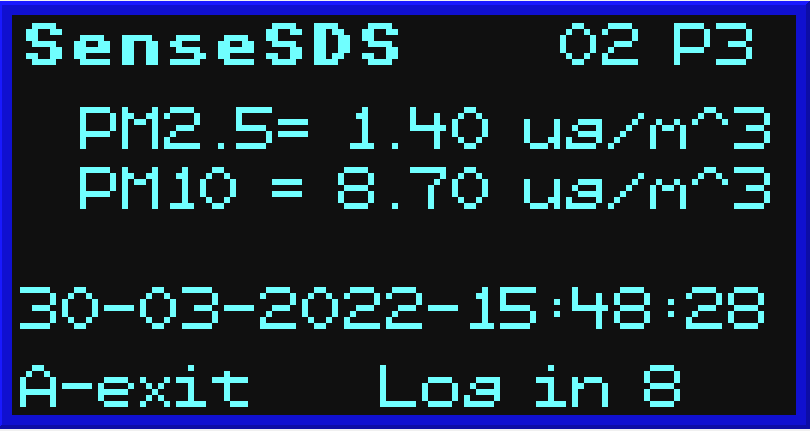
What is showing on the screen?
- Top Row: Name of app; ID of Kookaberry (02); Pin for connection of peripheral (P3)
- Second Row: Mass of PM2.5 particles in micrograms in one cubic metre of air
- Third Row: Mass of PM10 particles in micrograms in one cubic metre of air
- Fourth Row: Date and elapsed time since commencement of Run
- Fifth Row: Button A is Exit from app; time in secs until next logging event.
Using the App
Trying it out
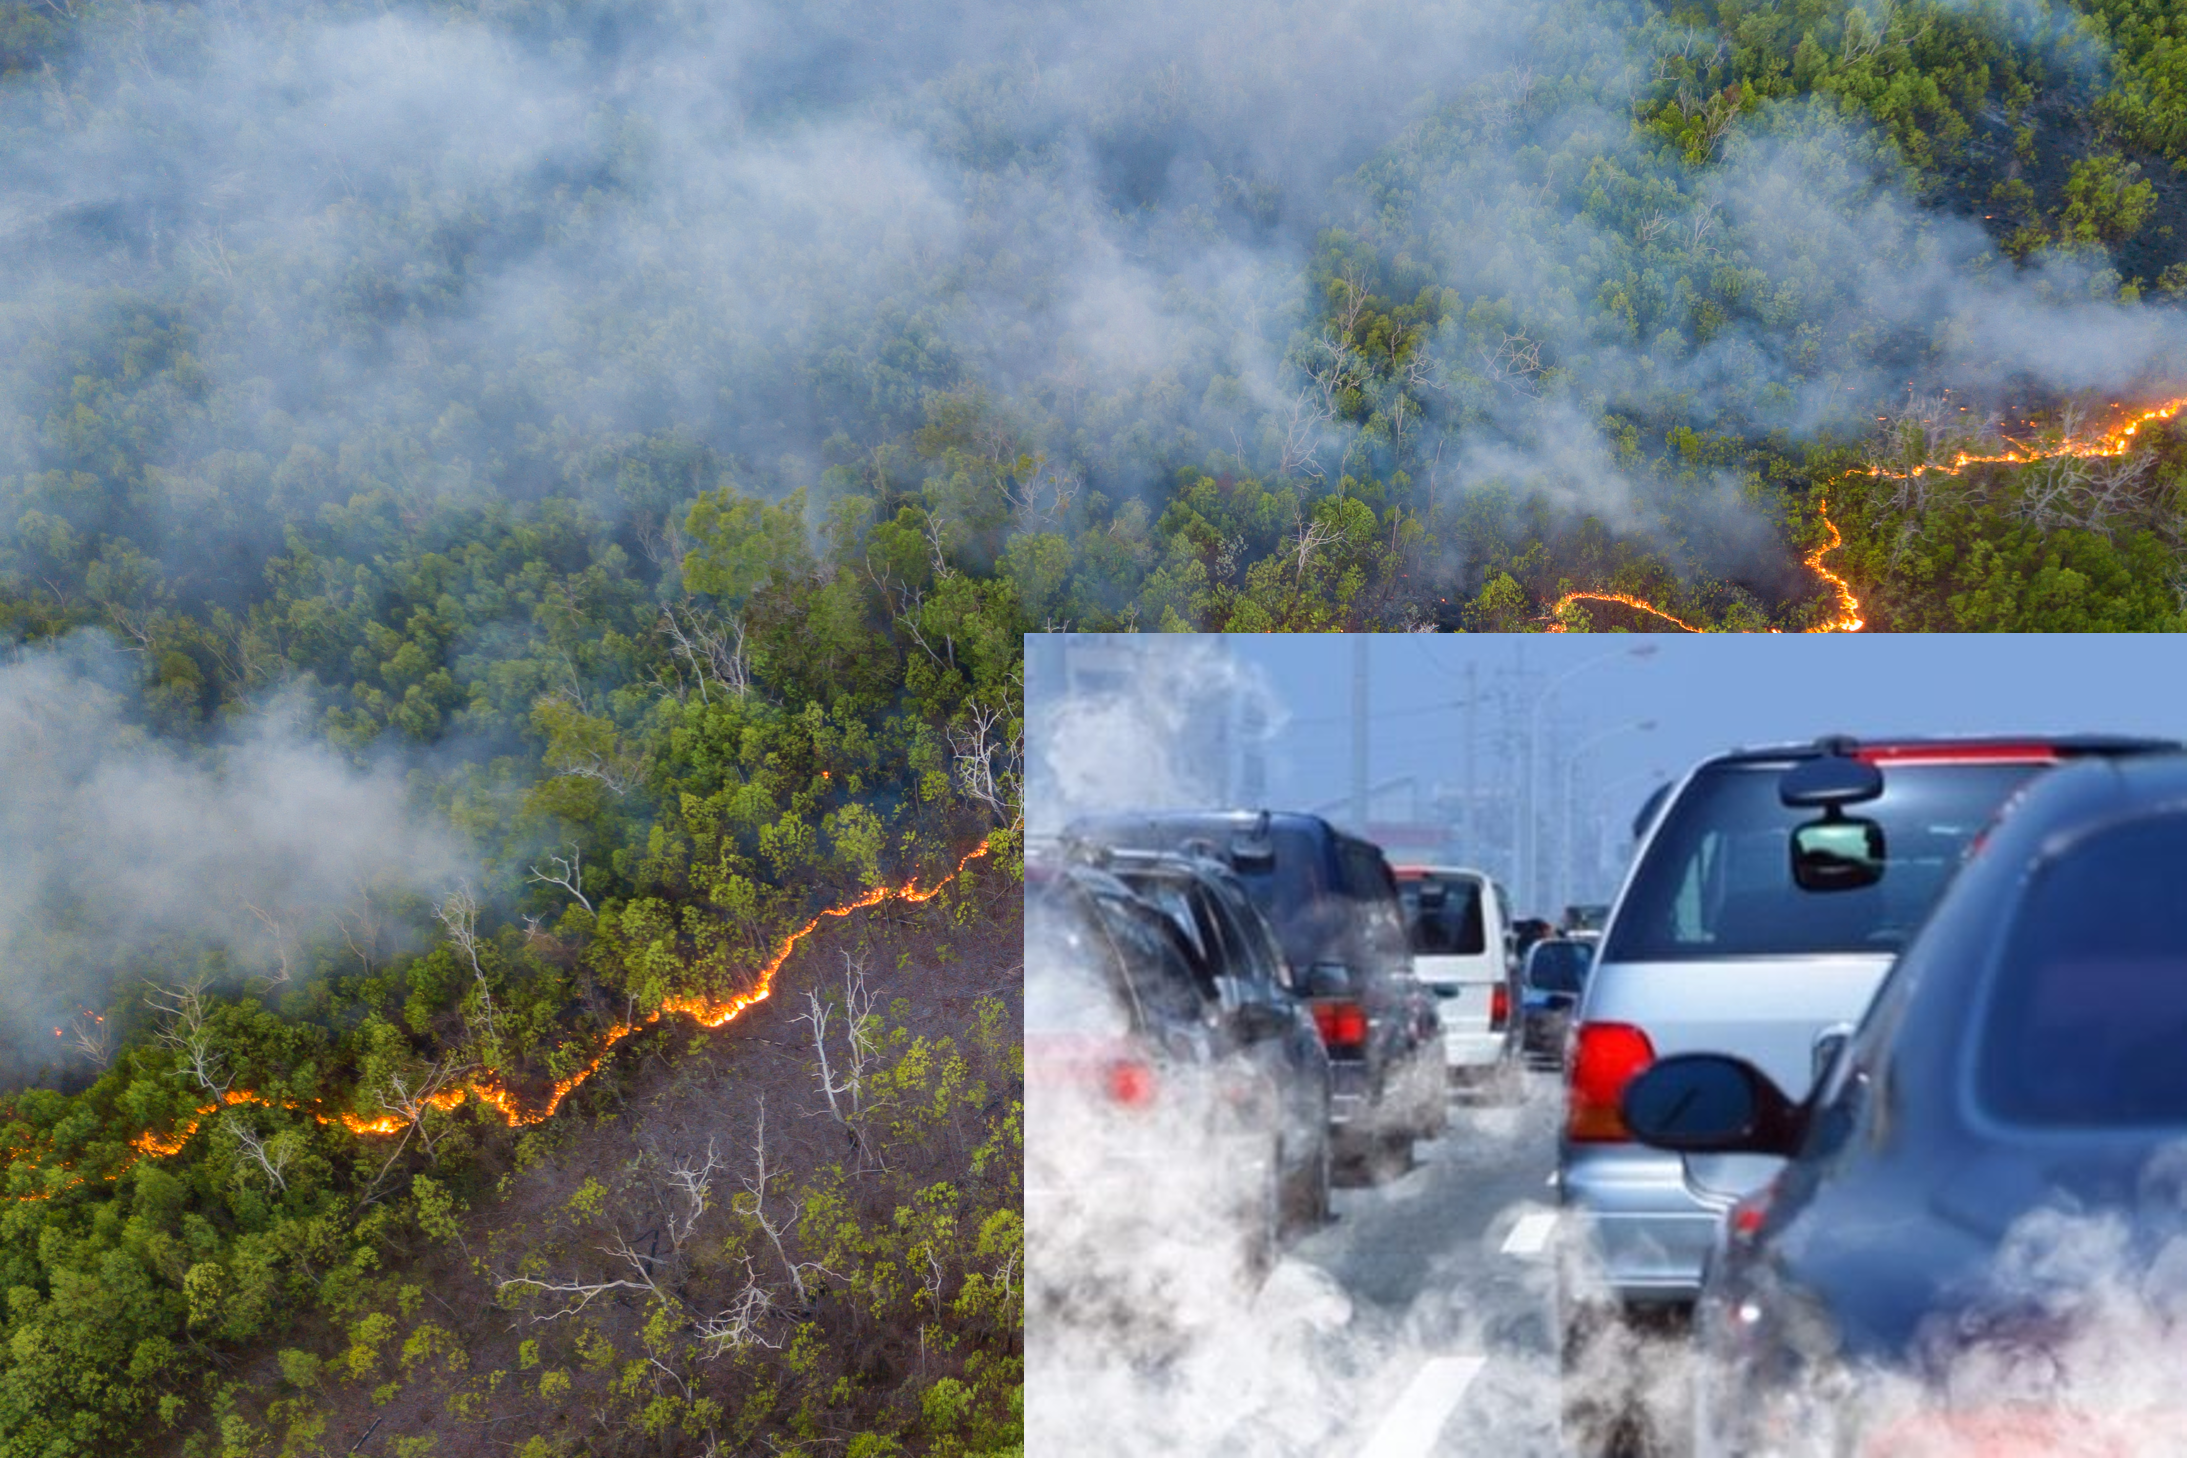
Take the Kookaberry outside and place it near a piece of burning wood (or a lighted match), or beside the exhaust pipe of a stationary car with its engine running. Observe the very high readings and how far away you need to be before the readings return to a much lower value.
Comparing your readings with values posted by your State
The measurement value posted by States is the average reading of a number of measurements over a one hour period.
Set the Kookaberry to log data every 60 secs in the _config app and set the current time by using the SenseRX app on another Kookaberry connected to your computer and running any of the KookaSuite elements. The datalogging function will work without synchronising to real time, but date stamping with start from an arbitrary default date/time.
To measure the quality of the air outside your classroom, attach a length of 6mm plastic tube (you can get it at Bunnings) to the input spigot of the SDS011 and lead it outside of a window.
Averaging the Excel measurements
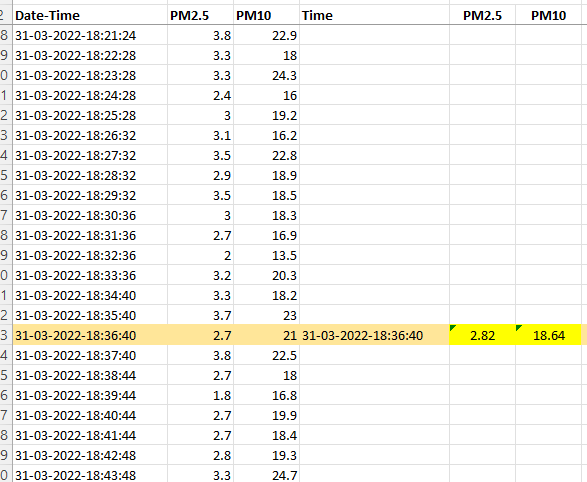
When you have finished monitoring – maybe over a 24 hour period, connect your Kookaberry to your computer and upload the SenseSDS.csv file in the Kookaberry’s USB memory. The first three columns will show the date and time the measurements were made (Day-Month-Year-Hour-Minute-second) in the first column and the instantaneous PM2.5 and PM10 concentrations (in micrograms per cubic metre of air) in the second and third columns.
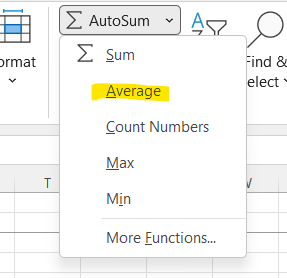
You will now have to find the average of the 60 measurements made in each hour of observation to compare with State data for your region. Create three more columns and highlight the half hour reading for each elapsed 60 minutes. Select the new P2.5 cell in the highlit row and use the auto-sum average function to find the average of the 60 readings. Repeat for the new PM10 column. Copy the Date-Time from Column A to the new Time column. Do this to find the average for every consecutive 60 minutes.
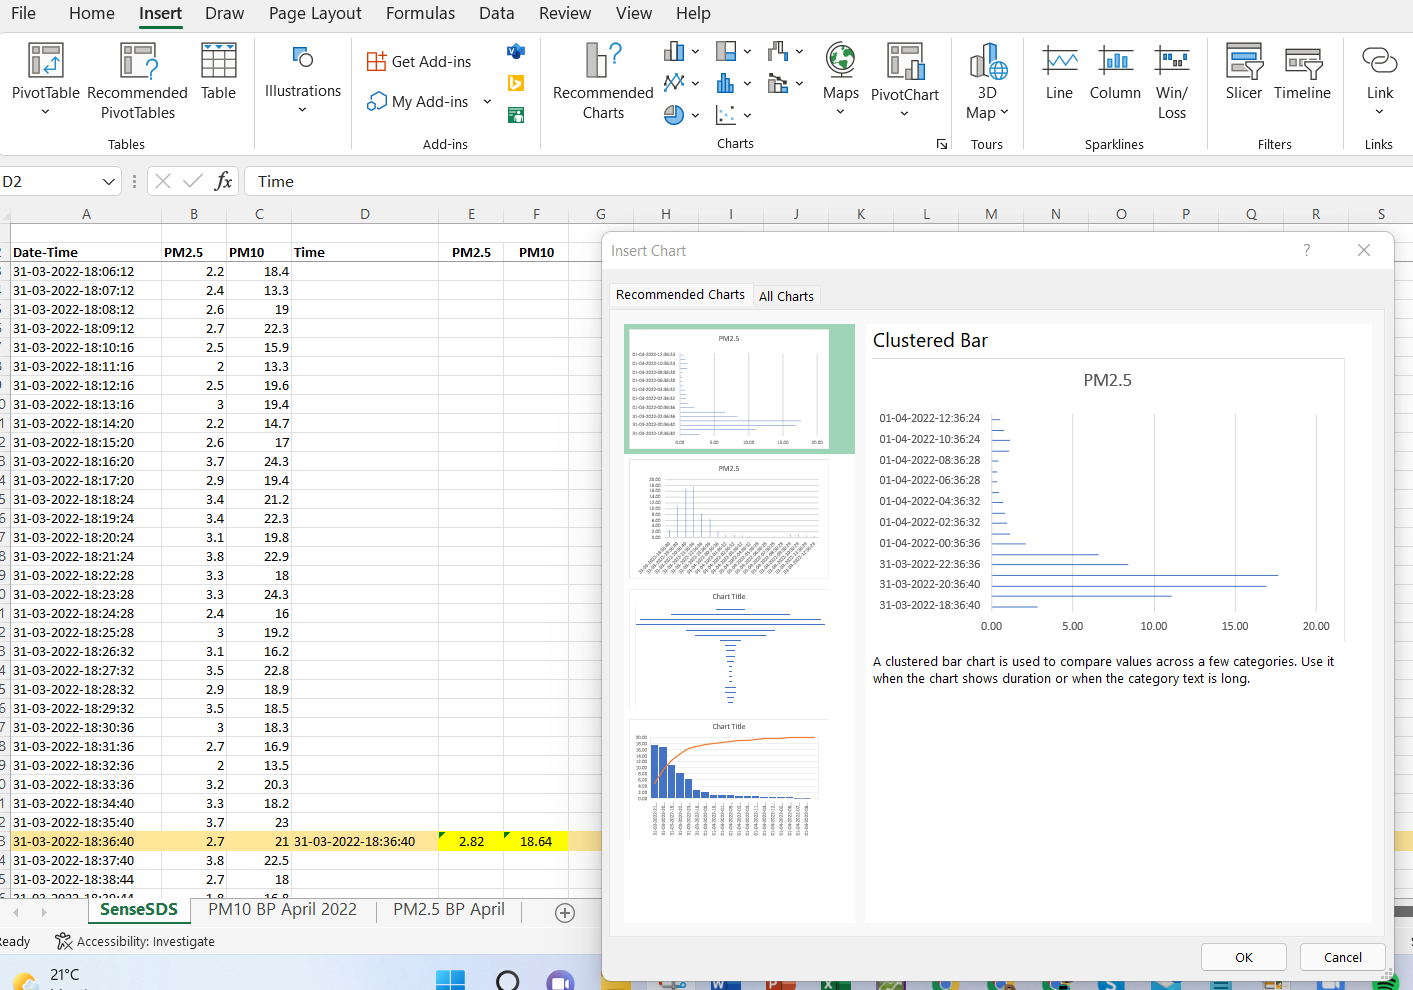
Now select the new Time and PM2.5 columns and select Insert and Recommended Charts in the top bar menu. You should see something like the screen shot below. Press OK and the cart will show on the same page as your original data.. Click anywhere to fix the chart in place and then right click on the chart boundary to bring up a menu that includes “Move Chart”. Click on this to open the chart in a new page in the workbook. Now select the new Time column, hold down the Ctrl key and select he new PM10 column. This will select both columns. Now repeat the cart selection process and move the PM10 chart to another page in the workbook.
Select the Chart Design element in the header menu and format your chart.
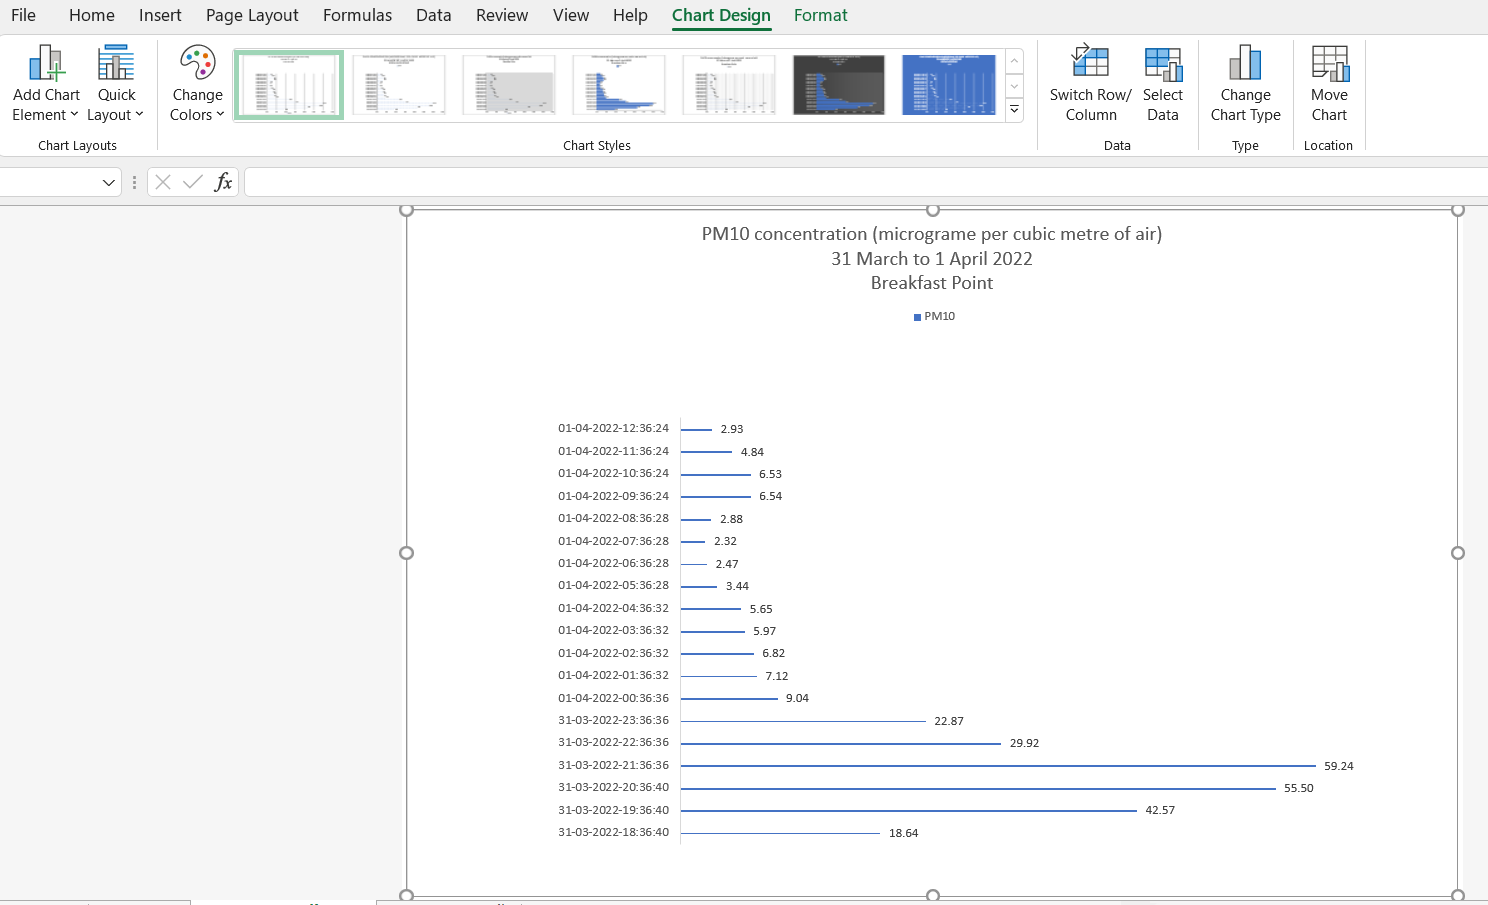
Comparison of Results
The data used for the above example were measured at Breakfast Point (an inner-West suburb of Sydney, Australia between 6pm on the 31st March to 1pm on the 1st April. The weather was very wet and the humidity was high – not the ideal conditions to measure dust pollution.
You should perform comparison measurements on days without rain!