This App measures, logs, and transmits temperature (T) data using a waterproof DS18B20 sensor on a 1m three wire lead terminated in a jst connector.
Contents
Step 3: Running the app (Single sensor real time data logging)
Displaying and analysing the data (Connected to PC/Mac)
Using Excel to display the data
Receiving the data remotely via SenseRx App
Receiving and displaying the data via a Raspberry PI server
Directions
Step 1: Setup
Set up app by plugging the DS18B20 sensor into P4

Step 2: Running the app
Navigate to the the SenseDS18 app and press Button B to run.

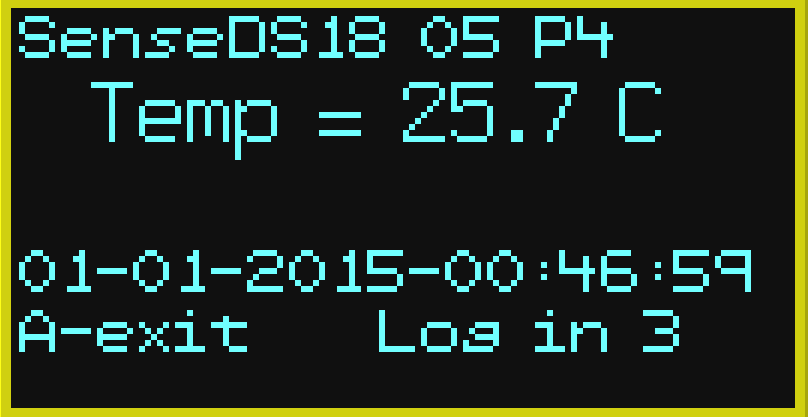
What is showing on the Home screen?
- Row 1: Name of peripheral being used; ID of Kookaberry being used[ID is set in the _config app at the top of the menu]; and connector number for plugging in sensor
- Row 2: Temperature in degrees Celsius
- Row 3: [Blank]
- Row 4: Date and Time. [This can be set to real time using the Kookatime apps]
- Row 5: Button A for Exit; time in seconds until start of next data logging sample. [This is set in the _config app at the top of the menu with a default of every 2 seconds.]
NOTE: if the sensor has NOT been plugged into the Kookaberry before turning it on and running the app, a screen will appear prompting you to plug the sensor into P4

Step 3: Running the app (Single sensor real time data logging)
- Set the real time using the KookatimeTX app. [This is not necessary if spot measurement, or simple elapsed time data logging is all that is required.]
- Run the app for as long as required. The data will be logged at the sampling interval set with the _config app. The default is 10 secs but can be changed by using Buttons C&D.
- The logged data will be stored as a CSV file in the Kookaberry’s USB memory.
Displaying and analysing the data (Connected to PC/Mac)
The*csv files are added to the bottom of the file list in the USB root memory.

The data can be retrieved when the Kookaberry is connected to a computer and displayed for analysis on the class monitor or whiteboard. Two methods of display are provided
- Opening the CSV file in Excel or any other spreadsheet programme, and then using the graphical algorithms within the spreadsheet app to display the data as a graph or some other representation.
- Converting the CSV file into an htm file for showing the resulting graph or other representation directly in a web browser. [NOTE: This conversion is made within the Kookaberry using the GraphCSV app]
Using Excel to display the data
When you open the SenseDS18.csv file stored in the USB memory, the data looks like this [Note: the the date stamp is the default condition – not real time]

Learn how to display the data on your PC and whiteboard in the Tutorial:Excel [Under development]

Displaying the data directly into your web browser
Double clicking on the SenseDS18.htm file should bring the data up in the format selected in the GraphCSV app.
Learn more about displaying data in your browser in the Tutorial :Using the GraphCSV app [Under development]

Receiving the data remotely via SenseRx App
The measured data is transmitted (but without the date stamp) once per sensor sample over the packet radio. This can be seen in real time in the REPL window of the KookaIDE editor if connected to a computer when running the app.
[Note: The first line after the >>>> shows the value of the parameters set in the _config app]

When the Kookaberry measuring the data is disconnected from the PC/Mac, the transmitted data stream can be received on any other Kookaberry running the SenseRx app

The data received by the Kookaberry running the SenseRx app can be recovered from its USB memory and displayed and analysed in the same way as other CSV data files. The SenseRx CSV data looks like this

The SenseRx app can receive and capture data from multiple Kookaberries in real time. In the case shown in the screenshot, it is receiving data from DS18B20 temperature sensor and a DHT22 sensor combining both Temperature and Humidity.

The SenseRx CSV data for multiple sensors looks like this.

Receiving and displaying the data via a Raspberry PI server
Development is ongoing to use a Raspberry Pi as a classroom server to display data from multiple Kookaberries (within Bluetooth range of up to 10metres) in real time via a WiFi connection to any other other WiFi equipped device.


