This app is a utility that converts comma-separated-variable data (CSV) files, as are produced by the Kookaberry’s datalogging apps in the Kookaberry’s file store, into web-browser viewable graphs.
Directions
Step 1: Finding the app
Navigate to the GraphCSV app and press Button B to run

Step 2: Running the app

What is showing on the screen?
-
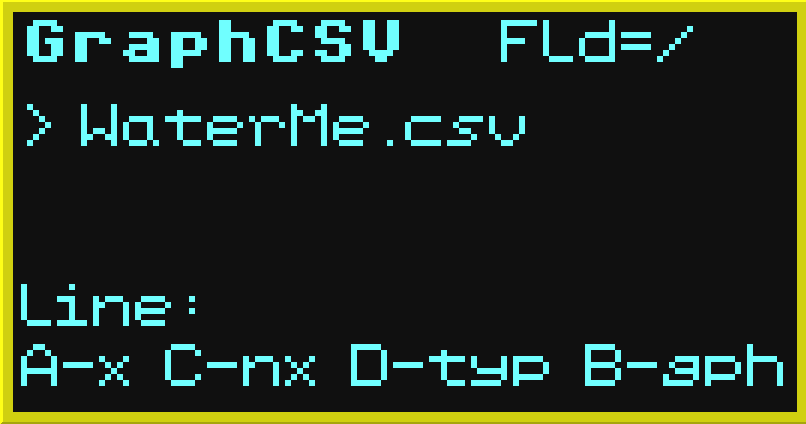
Top: The app name, GraphCSV, and the current folder (the root folder) in the Kookaberry file store.
-
Next three lines: These show the CSV files in the file store folder. They change as the files change. The file preceded by the ‘>’ symbol is the currently selected file.
-
Second last line: The type of chart that will be created when processed. The types available include ‘line’, ‘spline’, ‘step’, ‘area’, ‘area-spline’, ‘area-step’, ‘bar’, ‘scatter’, ‘pie’, ‘donut’, and ‘gauge’.
-
Bottom line: The functionality of the Kookaberry buttons: A (exit the app), C (select the next file), D (select the next type of graph), and B (read the selected file and create a HTML graph of the selected type.
Step 3: Using the app
When button B is pressed, the selected file name will appear on the second last line after the colon ‘:’ while the graph is being prepared. A file of type ‘name.htm’ is created where ‘name.CSV’ was selected.
The blue light on the back of the Kookaberry will light during the conversion of the CSV file and could take a little time if there is a large amount of data. Wait for the conversion to finish before connecting (or reconnecting) as described below.
To view the graph, connect (or reconnect) the Kookaberry to a computer USB port and navigate to the root folder of the Kookaberry file store using Windows Explorer on PC or Finder on a Macintosh. The .htm files will have web browser icons. Double click on the file and a web page showing the graph should appear per the example below.

Hovering the cursor over a data point will show its value, as depicted. Please note that the graph appearance is entirely dependent on the CSV file contents and the graph type selected.
The .htm file produced may be copied to a computer for later display, but the c3d3 folder in the Kookaberry file store must also be copied to the same location as it contains the scripts necessary to properly display the graph. Please see https://c3js.org/ for more technical detail on the web graphs.


