This app creates various types of graph from csv files for direct display in the browser of a computer.
It converts the csv (comma separated variable) format used to store logged data in the Kookaberry’s USB drive to html (hypertext markup language). Html is a file format used to construct a web page.
All of the types of graph generated by this app can also be generated from the default csv data file. However, unlike the html graphs, Excel graphs can be continuously modified and customised from the same original data set.
Directions
Step 1: Setup
No setup is needed as this app is run straight from the Menu
Step 2: Running the app
Once an app has finished logging its data, it stores it in the Kookaberry’s USB memory as [name of app].csv file. This file is then available for download into computer for display and analysis using Excel.
If an instant graph is required, navigate to to the GraphCSV app and press Button B to run

What is showing on the screen?
-
Top Row: Name of app and destination folder on the computer – in this case the root directory.
-
Second Row: List of csv files currently stored in the USB memory
-
Third Row: Type of graph to be generated – in this case a line graph. See below for a description of all the types of graph available
-
Fourth Row: Button A is Exit from app; Button C selects the file to be converted to html; Button D changes the type of graph to be displayed; and Button B generates it.
Writing html data and storing in memory
The blue LED on the back of the Kookaberry will flash during conversion. This indicates that data is being written to memory. Do not interrupt this process by removing power prematurely. No permanent damage will be caused but the html file will be corrupted. The csv file is not lost – just try again….
IMPORTANT: Although the csv data has been converted to html format IT HAS NOT BEEN STORED IN THE USB MEMORY.
Power needs to removed from the Kookaberry and then re-instated to make this happen. When the Kookaberry is next connected to a computer, the file will appear as [Name of app].htm.
Double clicking on this file will display the graph in your browser.
To display a different type of graph from the one first selected, go back to the app and choose another one.
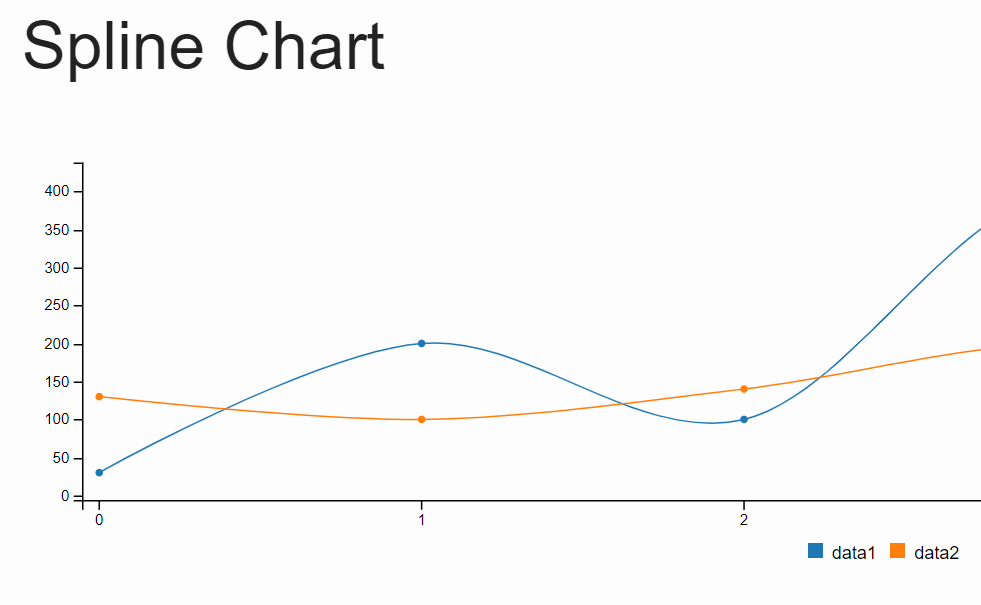
Different types of graph available